Quickstart
AcTag is a library for detecting and decoding AcTags in sonar and camera imagery. This guide will walk you through the process of installing AcTag and detecting AcTags in sonar imagery.
Installation
First, install the following dependencies if you do not already have them:
Run the following command to download the latest version of AcTag:
pip install actag
Usage
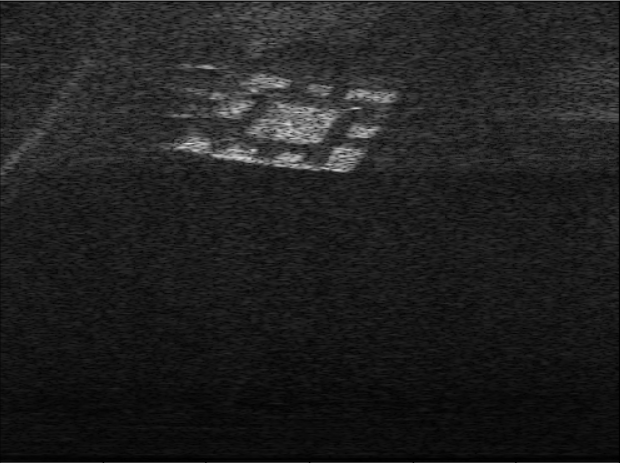
An example sonar image with an AcTag can be seen below. In this tutorial, we will demonstrate how to detect this AcTag.
Make a new python file and import the actag module:
import actag
Next, initalize the AcTag class:
detector = actag.AcTag(min_range=0.1, max_range=1.5, horizontal_aperture=1.0472,
                       tag_family="AcTag24h10", tag_size=0.130628571428644,
                       quads_random_seed=123456)
You will need to specify certain parameters of the sonar used to capture the image, including the minimum range, maximum range, and horizontal aperature. You will also need to specify information about the AcTag family, which represents the group of tags to which the pictured tag belongs. Finally, you will need to specify the size of the inner square of the physical AcTag in meters. See the AcTag class for more information on these parameters.
Because we have provided this image, we have already included the values for each of the required parameters. Our sonar was operating with a minimum range of 0.1 meters, and a maximum range of 1.5 meters. It used a horizontal aperature of 60 degrees, which corresponds to 1.0472 radians. The AcTag seen in the image is Tag #0 of the AcTag24h10 family, and the size of the inner square of the tag is 3/7ths of a foot, or about 0.1306 meters. In this example, we also set quads_random_seed to a specified value so that we get the same random numbers, and same results, each time. However, this is not required, and by default, quads_random_seed is set to None for random results.
Next, download the sonar image onto your computer and put it in the same folder as your python code. Then, use the following code to load the sonar image and pass it as a parameter to the run_detection method:
import cv2 # This library should have automatically downloaded when you ran "pip install actag"

my_sonar_image = cv2.imread("exampleSonarImage.png")
detected_tags = detector.run_detection(my_sonar_image)
Great! We’ve successfully run our image through the AcTag algorithm. Let’s take a look at the detected_tags variable by running print(detected_tags) to see if we detected anything…
[[0, array([[145, 315],
       [113, 339],
       [103, 280],
       [133, 244]]), array([[ 1.06060606, -0.00930468],
       [ 1.15757576, -0.04990695],
       [ 1.18787879,  0.04990695],
       [ 1.0969697 ,  0.11081034]])]]
Looks like we did! The detected_tags variable is a list of lists, where each inner list is a successfully detected tag. Let’s strip away the outer list to look at the individual tag we detected:
[0, array([[145, 315],
       [113, 339],
       [103, 280],
       [133, 244]]), array([[ 1.06060606, -0.00930468],
       [ 1.15757576, -0.04990695],
       [ 1.18787879,  0.04990695],
       [ 1.0969697 ,  0.11081034]])]
This list has three enteries in it. The first entry is the tag ID, the second entry is the pixel coordinates of the tag corners, and the third entry is the range and azimuth coordinates of the tag corners relative to the sonar. Let’s write a script to make this a little more readable. Run the following code to do so:
# Helper function that parses AcTag detection data
# and prints the results
def parse_and_print_results(detected_tags):

    num_detected_tags = len(detected_tags)
    print("Number of Detected Tags: ", num_detected_tags)

    for i in range(0, len(detected_tags)):
        print("==== Tag #" + str(i) + " ====")
        detected_tag = detected_tags[i]
        print("Tag ID: ", detected_tag[0])
        print("Corner Locations: \n", detected_tag[1])
        print("Corner Range & Azimuth Locations: \n", detected_tag[2])

# Parse and print results
parse_and_print_results(detected_tags)
Now, we get the following output:
Number of Detected Tags:  1
==== Tag #0 ====
Tag ID:  0
Corner Locations:
 [[145 315]
 [113 339]
 [103 280]
 [133 244]]
Corner Range & Azimuth Locations:
 [[ 1.06060606 -0.00930468]
 [ 1.15757576 -0.04990695]
 [ 1.18787879  0.04990695]
 [ 1.0969697   0.11081034]]
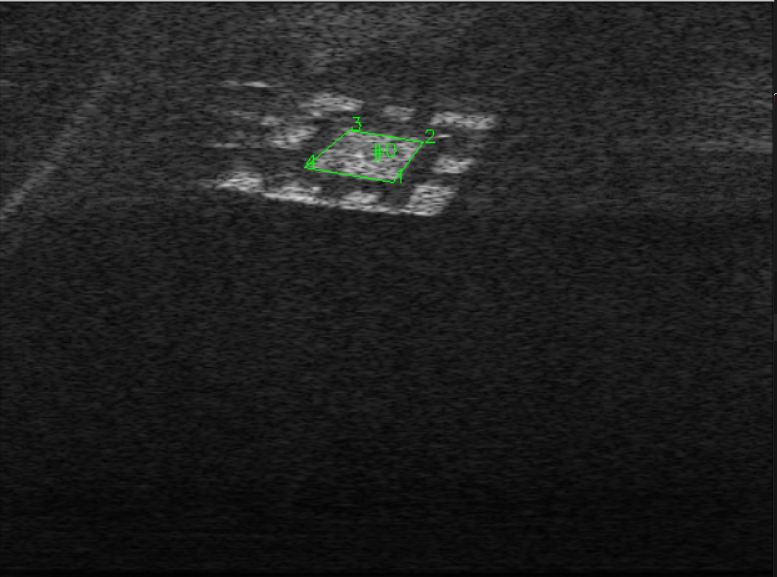
Let’s take this one step further. We can easily visualize the results by taking the tag corner locations and ploting them onto the original image. Run the following code on your machine:
# This helper function draws the detected tags onto the image
def visualize_decoded_tags(my_sonar_image, detected_tags):

    output_image = cv2.cvtColor(my_sonar_image, cv2.COLOR_GRAY2RGB)
    for detected_tag in detected_tags:
        # Extract corner points
        corner_locs = detected_tag[1]
        ptA = (corner_locs[0][0], corner_locs[0][1])
        ptB = (corner_locs[1][0], corner_locs[1][1])
        ptC = (corner_locs[2][0], corner_locs[2][1])
        ptD = (corner_locs[3][0], corner_locs[3][1])

        # Reverse x and y to get the correct orientation with cv2.imshow()
        ptA = (ptA[1], ptA[0])
        ptB = (ptB[1], ptB[0])
        ptC = (ptC[1], ptC[0])
        ptD = (ptD[1], ptD[0])

        # Draw the bounding box of the AcTag Square
        color = (0, 255, 0)
        cv2.line(output_image, ptA, ptB, color, 1)
        cv2.putText(output_image, "1", ptA, cv2.FONT_HERSHEY_SIMPLEX, 0.5, color, 1)
        cv2.line(output_image, ptB, ptC, color, 1)
        cv2.putText(output_image, "2", ptB, cv2.FONT_HERSHEY_SIMPLEX, 0.5, color, 1)
        cv2.line(output_image, ptC, ptD, color, 1)
        cv2.putText(output_image, "3", ptC, cv2.FONT_HERSHEY_SIMPLEX, 0.5, color, 1)
        cv2.line(output_image, ptD, ptA, color, 1)
        cv2.putText(output_image, "4", ptD, cv2.FONT_HERSHEY_SIMPLEX, 0.5, color, 1)

        # Put the Tag ID in the center
        center = (int((ptA[0] + ptC[0]) / 2), int((ptA[1] + ptC[1]) / 2))
        cv2.putText(output_image, "#" + str(detected_tag[0]), center,
            cv2.FONT_HERSHEY_SIMPLEX, 0.5, color, 1)

    return output_image

# Visualize decoded tags on the original image
output_image = visualize_decoded_tags(my_sonar_image, detected_tags)
cv2.imshow("Detected Tags", output_image)

# Press Q on keyboard while the window is selected to exit
if cv2.waitKey(10) & 0xFF == ord('q'):
       break
Now, we can clearly see the corner locations, the order of the corners, and the tag ID of the detected tag:
Quickstart Code Block
Here is all of the above code, consolidated into one code block for convenience:
import actag
import cv2

# Helper function that parses AcTag detection data
# and prints the results
def parse_and_print_results(detected_tags):

    num_detected_tags = len(detected_tags)
    print("Number of Detected Tags: ", num_detected_tags)

    for i in range(0, len(detected_tags)):
        print("==== Tag #" + str(i) + " ====")
        detected_tag = detected_tags[i]
        print("Tag ID: ", detected_tag[0])
        print("Corner Locations: \n", detected_tag[1])
        print("Corner Range & Azimuth Locations: \n", detected_tag[2])

# This helper function draws the detected tags onto the image
def visualize_decoded_tags(my_sonar_image, detected_tags):

    output_image = cv2.cvtColor(my_sonar_image, cv2.COLOR_GRAY2RGB)
    for detected_tag in detected_tags:
        # Extract corner points
        corner_locs = detected_tag[1]
        ptA = (corner_locs[0][0], corner_locs[0][1])
        ptB = (corner_locs[1][0], corner_locs[1][1])
        ptC = (corner_locs[2][0], corner_locs[2][1])
        ptD = (corner_locs[3][0], corner_locs[3][1])

        # Reverse x and y to get the correct orientation with cv2.imshow()
        ptA = (ptA[1], ptA[0])
        ptB = (ptB[1], ptB[0])
        ptC = (ptC[1], ptC[0])
        ptD = (ptD[1], ptD[0])

        # Draw the bounding box of the AcTag Square
        color = (0, 255, 0)
        cv2.line(output_image, ptA, ptB, color, 1)
        cv2.putText(output_image, "1", ptA, cv2.FONT_HERSHEY_SIMPLEX, 0.5, color, 1)
        cv2.line(output_image, ptB, ptC, color, 1)
        cv2.putText(output_image, "2", ptB, cv2.FONT_HERSHEY_SIMPLEX, 0.5, color, 1)
        cv2.line(output_image, ptC, ptD, color, 1)
        cv2.putText(output_image, "3", ptC, cv2.FONT_HERSHEY_SIMPLEX, 0.5, color, 1)
        cv2.line(output_image, ptD, ptA, color, 1)
        cv2.putText(output_image, "4", ptD, cv2.FONT_HERSHEY_SIMPLEX, 0.5, color, 1)

        # Put the Tag ID in the center
        center = (int((ptA[0] + ptC[0]) / 2), int((ptA[1] + ptC[1]) / 2))
        cv2.putText(output_image, "#" + str(detected_tag[0]), center,
            cv2.FONT_HERSHEY_SIMPLEX, 0.5, color, 1)

    return output_image

# Run the detection algorithm
detector = actag.AcTag(min_range=0.1, max_range=1.5, horizontal_aperture=1.0472,
                       tag_family="AcTag24h10", tag_size=0.130628571428644,
                       quads_random_seed=123456)
my_sonar_image = cv2.imread("exampleSonarImage.png")
detected_tags = detector.run_detection(my_sonar_image)

# Parse and print results
parse_and_print_results(detected_tags)

# Visualize decoded tags on the original image
output_image = visualize_decoded_tags(my_sonar_image, detected_tags)
cv2.imshow("Detected Tags", output_image)

# Press Q on keyboard while the window is selected to exit
if cv2.waitKey(10) & 0xFF == ord('q'):
       break
Next Steps
Congratulations! You’ve successfully detected an AcTag. For more examples of the various ways to detect AcTags and plot the results, see Detecting AcTags. It includes multiple useful examples for first-timers, including:
Detecting AcTags in a camera with the AprilTag library
Plotting detected tags in a polar coordinate system
Detecting AcTags in a video feed
If you want to see information on the provided AcTag families, or to learn how to generate your own, see Picking an AcTag Family. If you want to start capturing imagery of AcTags in your own environment, see Constructing AcTags and Using AcTags. Finally, if you are interested in altering the source code or contributing to the AcTag repository, please refer to Developing AcTag.